
The Hoot
Actionable ideas for the busy trader delivered daily right up front
- Monday lower.
- ES pivot 1958.25. Holding below is bearish.
- Rest of week bias lower technically.
- Monthly outlook: bias lower.
- Single stock trader: VZ not a swing trade buy.
The selling resumed on Friday with typical triple witching madness on huge volume even for an options expiration day that sent just about everything lower leaving the charts with awash in a sea of red with some candles that changed things in interesting ways. So let's move on to the last full week of September and see if we can start making some calls again now that we have the Fed and op-ex out of the way.
The technicals
The Dow: On Friday the Dow confirmed Thursday's tall inverted hammer by dumping 290 points on a tall red candle. That was enough to drop it right out of its most recent rising RTC for a bearish setup. The indicators all continued falling from overbought and the stochastic has now completed a clear bearish crossover. So there's nothing at all bullish looking about this chart for Monday.
The VIX: Somewhat surprisingly perhaps on Friday given all the market chaos the VIX did rise but only 5.39%. And it did that on a small gap-up red spinning top. The indicators remain oversold but not dramatically so and we do now seem to have a completed bullish stochastic crossover. However that's in conflict with the reversal warning from the candles so overall I can't call this chart tonight.
Market index futures: Tonight, all three futures are lower at 12:16 AM EDT with ES down 0.41%. On Friday ES confirmed Thursday's tall inverted hammer with its worst loss in nearly two weeks. That sent the indicators while moving lower off overbought. But they're still a long way from oversold. It was also enough of a move to send us out of a rising RTC for a bearish setup. And the new overnight seems to be continuing that trend with some further losses so there's nothing really bullish about this chart tonight .
ES daily pivot: Tonight the ES daily pivot falls again from 1987.00 to 1958.25. ES remains below its new pivot so this indicator remains bearish.
Dollar index: After a nasty fall on Thursday the dollar gapped down early Friday but then spent rest of the day climbing back up to retrace half of Thursday's losses on a classic bullish piercing pattern. The stochastic remains threaded out at oversold levels but the indicators now look to have bottomed at oversold and are rising again. So this chart looks higher on Monday.
Euro: And similarly on Friday the euro put in a dark cloud cover on a wide-ranging lopsided spinning top that finished by retracing half of Thursday's gains for a close at 1.1368. The new Sunday overnight seems to be confirming the bearish candle with a big gap down as indicators continue to fall off of overbought. So it looks fairly certain that the euro will close lower on Monday.
Transportation: Friday's chart of the trans looks just about exactly like the Dow so everything I wrote about the Dow applies here too. There's nothing bullish about this chart tonight.
Accuracy:
average points
January 8 6 4 1 0.563 627
February 6 4 5 3 0.692 183
March 7 6 5 4 0.647 976
April 3 8 7 0 0.273 1
May 6 5 5 2 0.615 581
June 8 6 3 4 0.706 552
July 10 1 5 4 0.938 1212
August 10 2 3 2 0.857 2314
September 5 2 6 0 0.714 1228
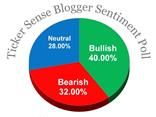
And the winner is...
Historically September is just a terrible month and this coming week is the worst week in September with the Dow being down 19 of the last 24 years according to The Stock Trader's Almanac. And right now it doesn't look like this year is going to be any different . Tonight all the charts look bearish so it looks like I'm just going to have to call Monday lower.
Single Stock Trader
Once again last Friday Verizon joined the rest of the lemmings diving off the cliff. It dropped 1.46% on a tall red candle that broke support around 44.68. But even with that the indicators are still not yet oversold and the stochastic is a long way from even beginning a bullish crossover. o even after three straight days of losses this dog is still not a swing trade buy.


No comments:
Post a Comment
Due to some people who just won't honor my request not to post spam on my blog, I have had to re-enable comment moderation. Comments may take up to 24 hour to appear, depending on when they're made. Sorry about that.