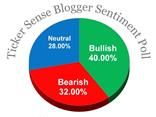
Actionable ideas for the busy trader delivered daily right up front
- Tuesday higher.
- ES pivot 1889.00 Holding above is bullish.
- Rest of week bias uncertain technically.
- Monthly outlook: bias lower.
- Single stock trader: VZ still not a swing trade buy.
Words simply fail me. I thought last Friday's action was crazy but Monday topped them all. Just for Laughs, I drew a descending RTC matching the current collapse and it shows that if this trend continues the dad will hit zero on December 8th of this year. Obviously Mr. Market is totally off his meds and has gone completely psycho. But we need to maintain some sort of stability and the charts are going to have to provide that as we take a look at Tuesday to see when this insanity may end.
The technicals
The Dow: This was absolutely amazing. On Monday the Dow put in the mother of all hammers, let's call it Thor's hammer with more than a 1000 point spread from top to bottom. We also saw selling volume reach a climax that exceeded even last Friday's crazy option expiration levels and finally sent the stochastic starting to curve around for a bullish crossover. Meanwhile RSI hit 7.5 which is well below the level from which reversals usually come . This is capitulation if I ever saw it. With a candle that traded entirely below the lower BB this is about as good a reversal indicator as I have ever seen. Ever.
The VIX: I thought Friday's VIX candle was crazy but on Monday the VIX picked up right where it left off finally topping out at over 53, a level that we haven't seen since the collapse of Lehman Brothers in October 2008. That only served to enhance the hyperbolic nature of the current run-up and we know how those things always end. Always. The indicators have now hit impossibly overbought levels with RSI almost 98 and the stochastic finally curving around for a bearish crossover.. It is completely amazing to me that the VIX should now be at levels we haven't seen since the Great Recession. I don't care what's going on in China, this doesn't make any sense whatsoever. With a gigantic inverted hammer the VIX now looks more than ready to come crashing back down to earth and reality.
Market index futures: Tonight, all three futures are finally higher at 1:09 AM EDT with ES up an astounding 2.34%. That's n even bigger move up than the crash lower we saw last night. I'm really running out of superlative adjectives here looking at the daily chart for ES. On Monday the selling simply accelerated as ES fell right over a cliff falling all the way down to 1831 before finally recovering a bit. With 5 days of ever taller red candles this is a textbook perfect inverse exponential and it's one that looks about ready to end. And the overnight seems to be supporting that theory. ES has now already retraced about 20% of Monday's losses and that's causing the stochastic to just barely give us a brand new bullish crossover while the rest of the indicators are still quite oversold. This to me looks ready to reverse on Tuesday. Heck we've already retraced half of Monday's losses and it's still only 1 AM.
ES daily pivot: Tonight the ES daily pivot crashes again from 1989.25 to 1889.00. That amazing 100 point drop, plus the gain in ES is enough to put it (finally) back above its new pivot, so this indicator now turns bullish.
Dollar index: Along with everything else on Monday there was outsized action in the dollar as it cratered an amazing 1.74%, crashing right down through its 200-day MA. And like the other charts, it's gone inverse hyperbolic with a series of gap-down candles with the gap getting larger and larger everyday. You'd think this is never going to end but this kind of pattern always ends with a big reversal . And with a giant spinning top on the books it looks like this is as good a time as any for that reversal to happen.
Euro: The euro meanwhile made a perfect mirror-image of the action in the dollar, rocketing right back up through its 200-day MA and through resistance at 1.1461 to close at 1.1603. a And like the other charts we have a classic exponential pattern here that's now got the indicators quite overbought and the stochastic in position for a bearish crossover. So it looks like the euro is ready to come back in for a landing pretty soon and the overnight is in fact finally, finally guiding lower in non-trivial fashion lending support to that theory.
Transportation: On Monday , the trains were pretty much a carbon copy of the Dow - giant hammer candle, indicators at extreme oversold levels. trading entirely below the lower BB with a stochastic just about to curve around for a bullish crossover. It looks like we're about out of sellers, so I think this one is finally ready to reverse.
Accuracy:
average points
January 8 6 4 1 0.563 627
February 6 4 5 3 0.692 183
March 7 6 5 4 0.647 976
April 3 8 7 0 0.273 1
May 6 5 5 2 0.615 581
June 8 6 3 4 0.706 552
July 10 1 5 4 0.938 1212
August 8 1 1 2 0.909 1785
And the winner is...
We have some really rare and freaky chart patterns going on the past two days. With everything at such extreme oversold/overbought levels, it's high time for a reversal. I'll note also that the SPX Hi-Lo indicator hit zero on Friday. It doesn't get any lower than that. And of course with the futures rallying hard in the overnight I'm reasonably confident that I can call Tuesday higher.
Single Stock Trader
On Monday Verizon put in the spinning top to end all spending tops. After bottoming at an incredible 38.06 it shot right back up again to finish at 44.74, still lower than its lower BB on massively increased volume. It also formed a bullish stochastic crossover and RSI has now hit one which is amazing in itself. This is about as good a reversal indication as you're ever going to see and in this crazy world we've got going right now I have to call it a buy.


Can you explain the meaning of an inverse hyperbolic pattern? Also can you explain how I should feel. I was out and stayed out, but now I feel like I'm missing something by not getting in. Is that just greed? Stupidity? Insanity? or all three?
ReplyDeleteRuss
Let me be more clear. There are multiple inverse hyperbolic functions, sine, cosine, tangent....ect. I guess I'm confused. My head is still spinning from yesterday!
ReplyDeleteHuh, you and me both. And everyone else too. The proper reaction when Mr. Market goes off his meds like this if you are already invested is to do nothing. All the people who panicked on Monday and sold are now kicking themselves.
DeleteAfter Monday's giant hammer, it was a textbook buying opportunity. Had I had any free cash (unfortunately, I don't at the moment) and had I been awake at 9:30 AM (I never am), I would have backed up the truck and loaded up. I called Tuesday higher last night and so it is.
If you missed the big bottom Monday morning, I'd just forget about it. With the VIX still near 30, picking a decent entry point is extraordinarily difficult for anything but a day trade.
By "inverse hyperbola" I just mean a line that falls off a cliff and accelerates on its way down. I haven't actually done ay curve-fitting to it so it might just be a steep parabola.
The whole point is that when a chart goes exponential, there's always a sudden collapse at the end, and that always comes just when it looks like it's set to go to infinity and beyond.
Well, I bought at the end of the day. Whew! This rollercoaster is not very smooth. Must be a wooden one.
ReplyDeleteRuss
Well if you bought at the end of Tuesday I think you'll probably be OK. The inverted hammer we ended up with is a bullish reversal sign as I'll go over in tonight's post.
Delete